
Data visualization in graphical form has been around for well over 200 years. Even the idea of 3D representation of data goes back to the 18th century.
In terms of XR data visualization, VR has been around since the 1960s, but only in the last decade have 3D data renderings come into scope for the technology. Before now, 3D charts, graphs, and data plots have been possible, but a 2D environment always constrained them within a desktop. This limited the amount of data users could see and manipulate, but it did serve as a first step towards the possibilities of what 3D data could become. Immersive technology began to take off in 2015 with the Oculus Rift DK1, which paved the way for people to get inside data and understand it from different vantage points.

XR Today spoke with Slanted Theory Co-founder and CEO, Laura Smith, to gain more insight about what is possible with data visualization when applying AR/VR technology. The ability to understand different dimensions of data means that information can be processed beyond just three core dimensions. Once companies realized the value of multidimensional data computation, the boundaries began to shift. Visualization up to ten dimensions is currently feasible by including elements such as audio, spatial analysis, or haptic feedback. These metrics all serve as pieces to the data puzzle that can impact the user in various ways.
“As to where we fit, Slanted Theory began in 2017 working with organizations to help manage growing data sets,” states Smith. “What we saw was that companies were struggling to find and communicate relevant insights with the growth of data capabilities. There was particular difficulty around communicating the complexities of multidimensional data to stakeholders at various levels. We saw an opportunity to use immersive technology as a way to visualize information in a way that is applicable to anyone.”
“3D visualization excels at offering an intuitive way to explore data without needing a background in data science”
Helping Teams Think Dynamically in Data
A survey by Forrester Research shows that 73% of all enterprise data analytics goes unused. Not only is that a tremendous amount of wasted questions, but it’s also an overwhelming amount of wasted answers and missed opportunities. A problem across any industry is having access to methods to grow data capabilities and not knowing how to present it in a digestible format. The more data that is generated, the more demand there is to consume it and find insights that will strategically move the company forward. Companies want the ability to make faster, more calculated decisions, which means data analysis needs to be standardized across organizations. Instead of a department of data scientists, there needs to be a way data can be consumed beyond what can be represented within dashboards and done so in a holistic way.
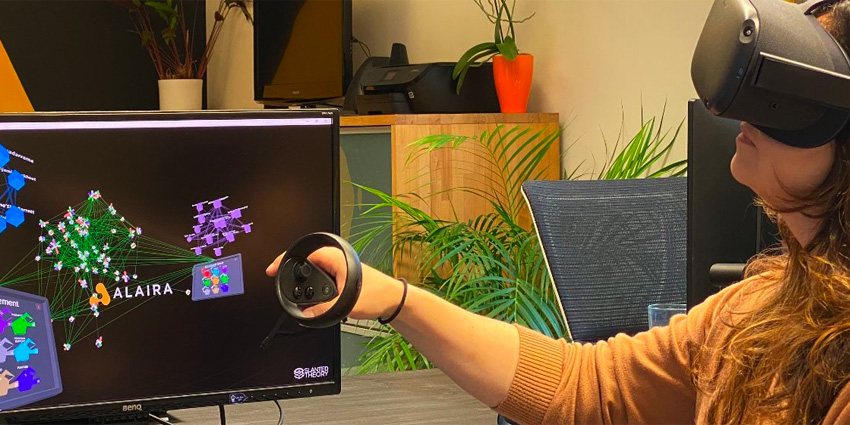
2D only offers specific answers to specific questions, making it time-consuming to connect all of the dots to give anyone an accurate depiction of what the data means. “The power of the Slanted Theory platform is that we take the raw data, put it into new and intuitive forms of visualizations that engage the user in a way that encourages them to dissect the data to find hidden insights, trends, and patterns with just a wave of a hand,” Smith continues. “All of this is done outside of just an isolated view. Users can collaborate with a team that can examine the same data at the same time. Ultimately, the questioning of data becomes more agile and dynamic in a way that’s not possible in 2D.”
Future Tech Accessible Now
As a startup, at the beginning of the journey, the main obstacle to adoption is the cost associated with headsets’ hardware. Enterprises such as Lockheed-Martin understand the ROI as the learning curve for users is reasonably shallow and saves time for integrating new technology. Data visualization is a daily task, yet the idea of using a headset to dissect data is still a foreign concept for most employees. To get around that hesitancy, Slanted Theory has begun offering its platform in an augmented reality version. The same in-depth data exploration is then available via tablet or smartphone. This serves as a stepping stone to conceptualizing the new possibilities with the technology as well as normalizing this specific modality for users.
“With every new technology, there has to be a mind shift on how to use it and what are the benefits it can offer. As immersive technology becomes more commonplace and mass-produced, the easier people will find it”
COVID heavily impacted the AR/VR industry in 2020. The one thing that flourished from mass distancing was the collaboration aspect of immersive technology. While collaboration is not directly correlated to data quality, it forces organizations to invest more time and effort into expanding what kind of data they incorporate in their analytics strategy. The ability to analyze raw data or even lidar data in an immersive collaborative environment is not only highly effective but is also becoming necessary. Demand is increasing for democratized data and ways to decipher what it means at multiple levels quickly. Platforms such as Slanted Theory are ideally positioned to make data science accessible on a large scale that can withstand physical distance and global crisis.